Description
For this assignment, you will parse a new dataset and generate a set of graphs. This assignment must be done individually. abq_weather_2020.csv, contains one year of weather data collected at the Albuquerque airport. The data includes daily temperature averages as well as information about daily wind speed.
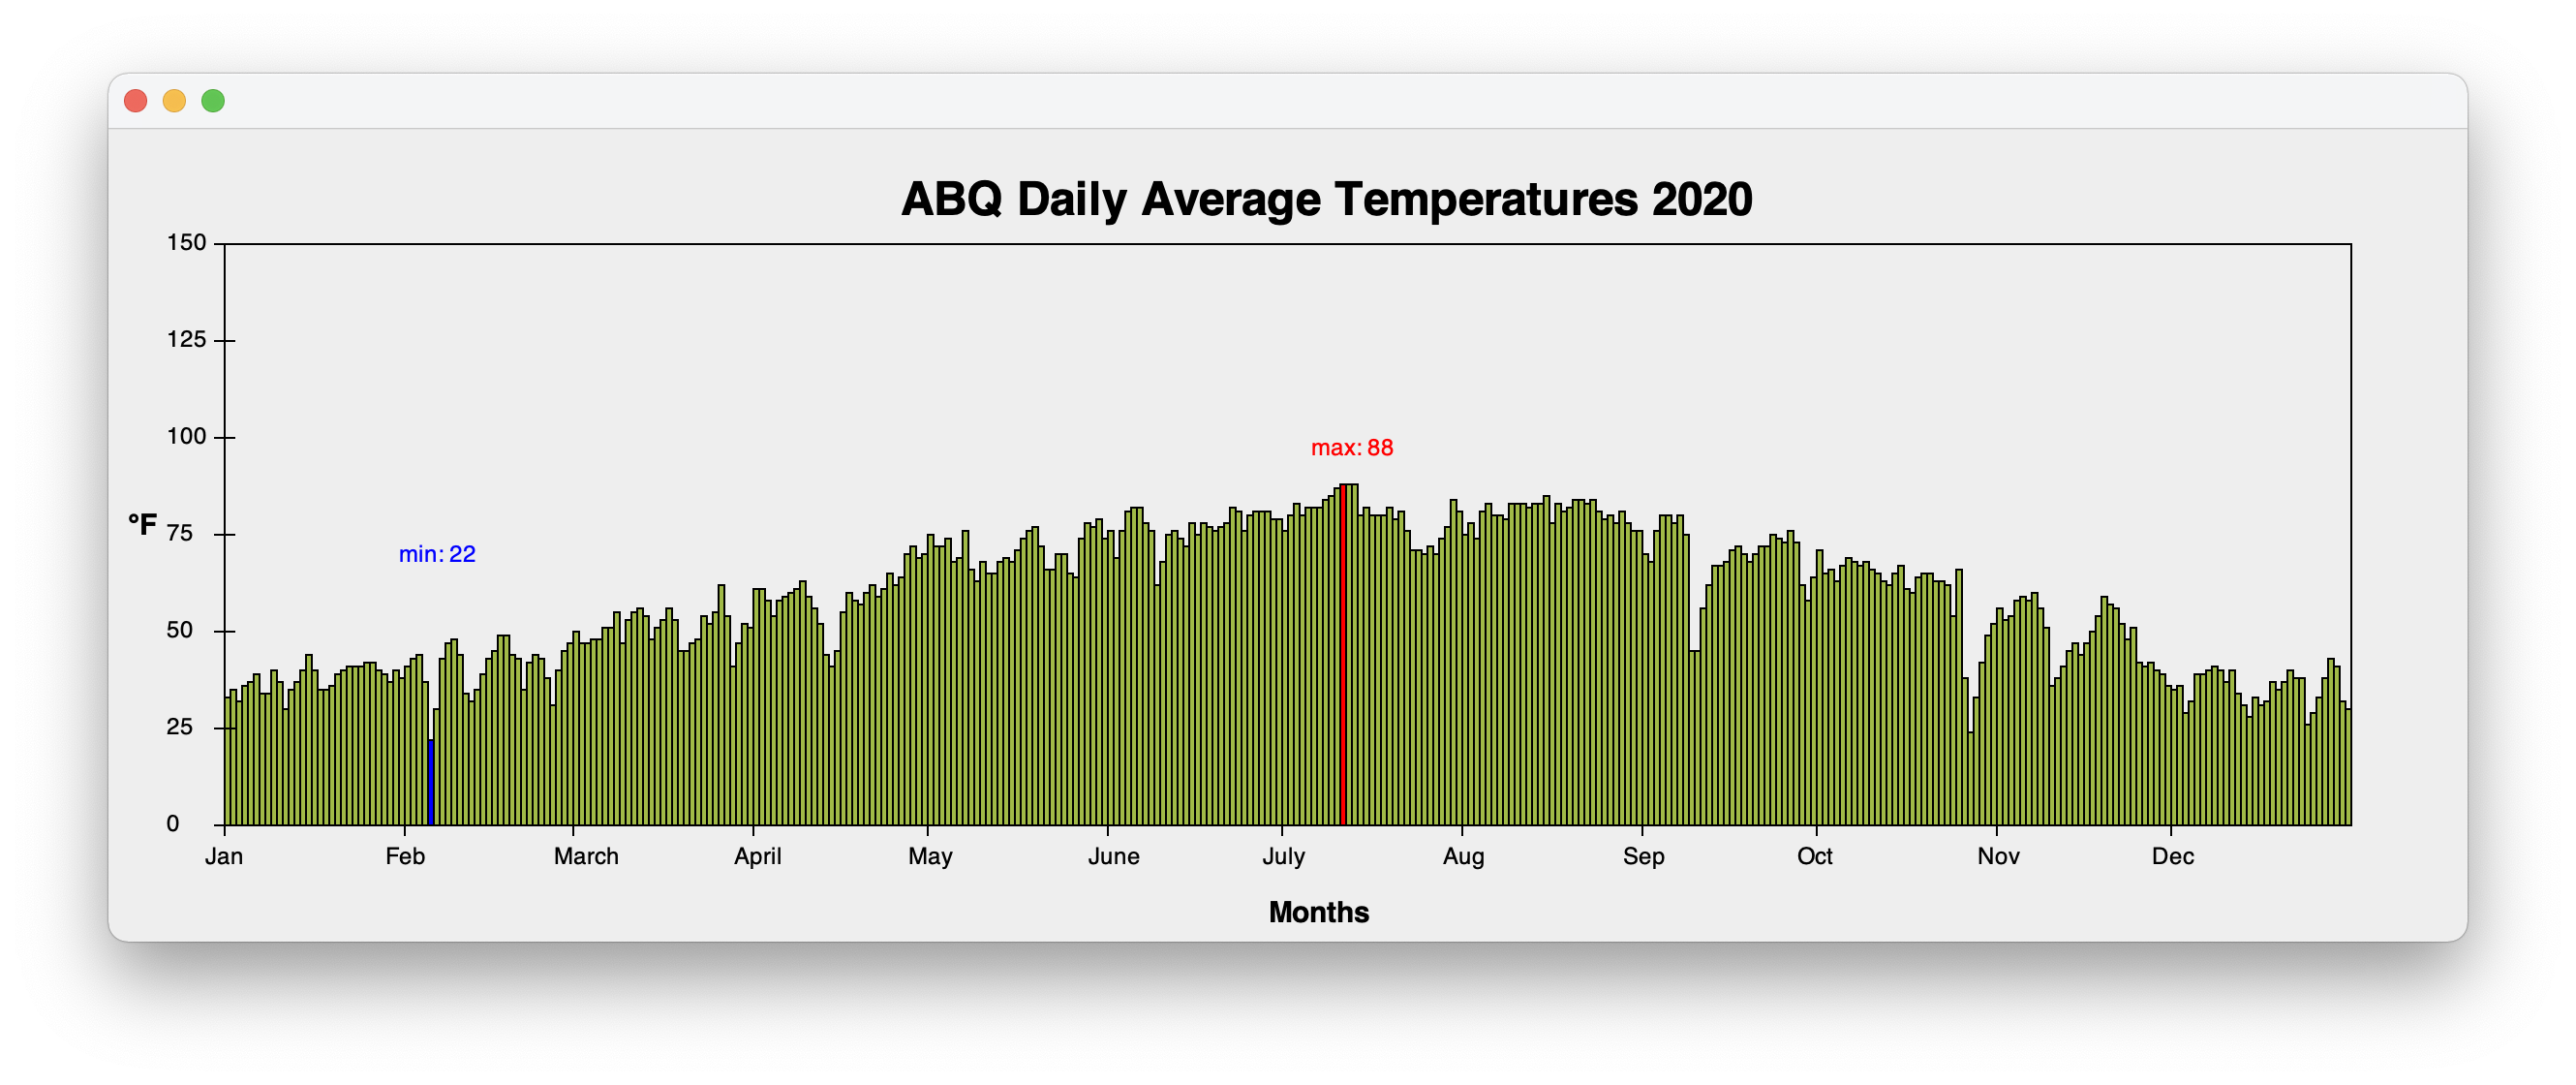
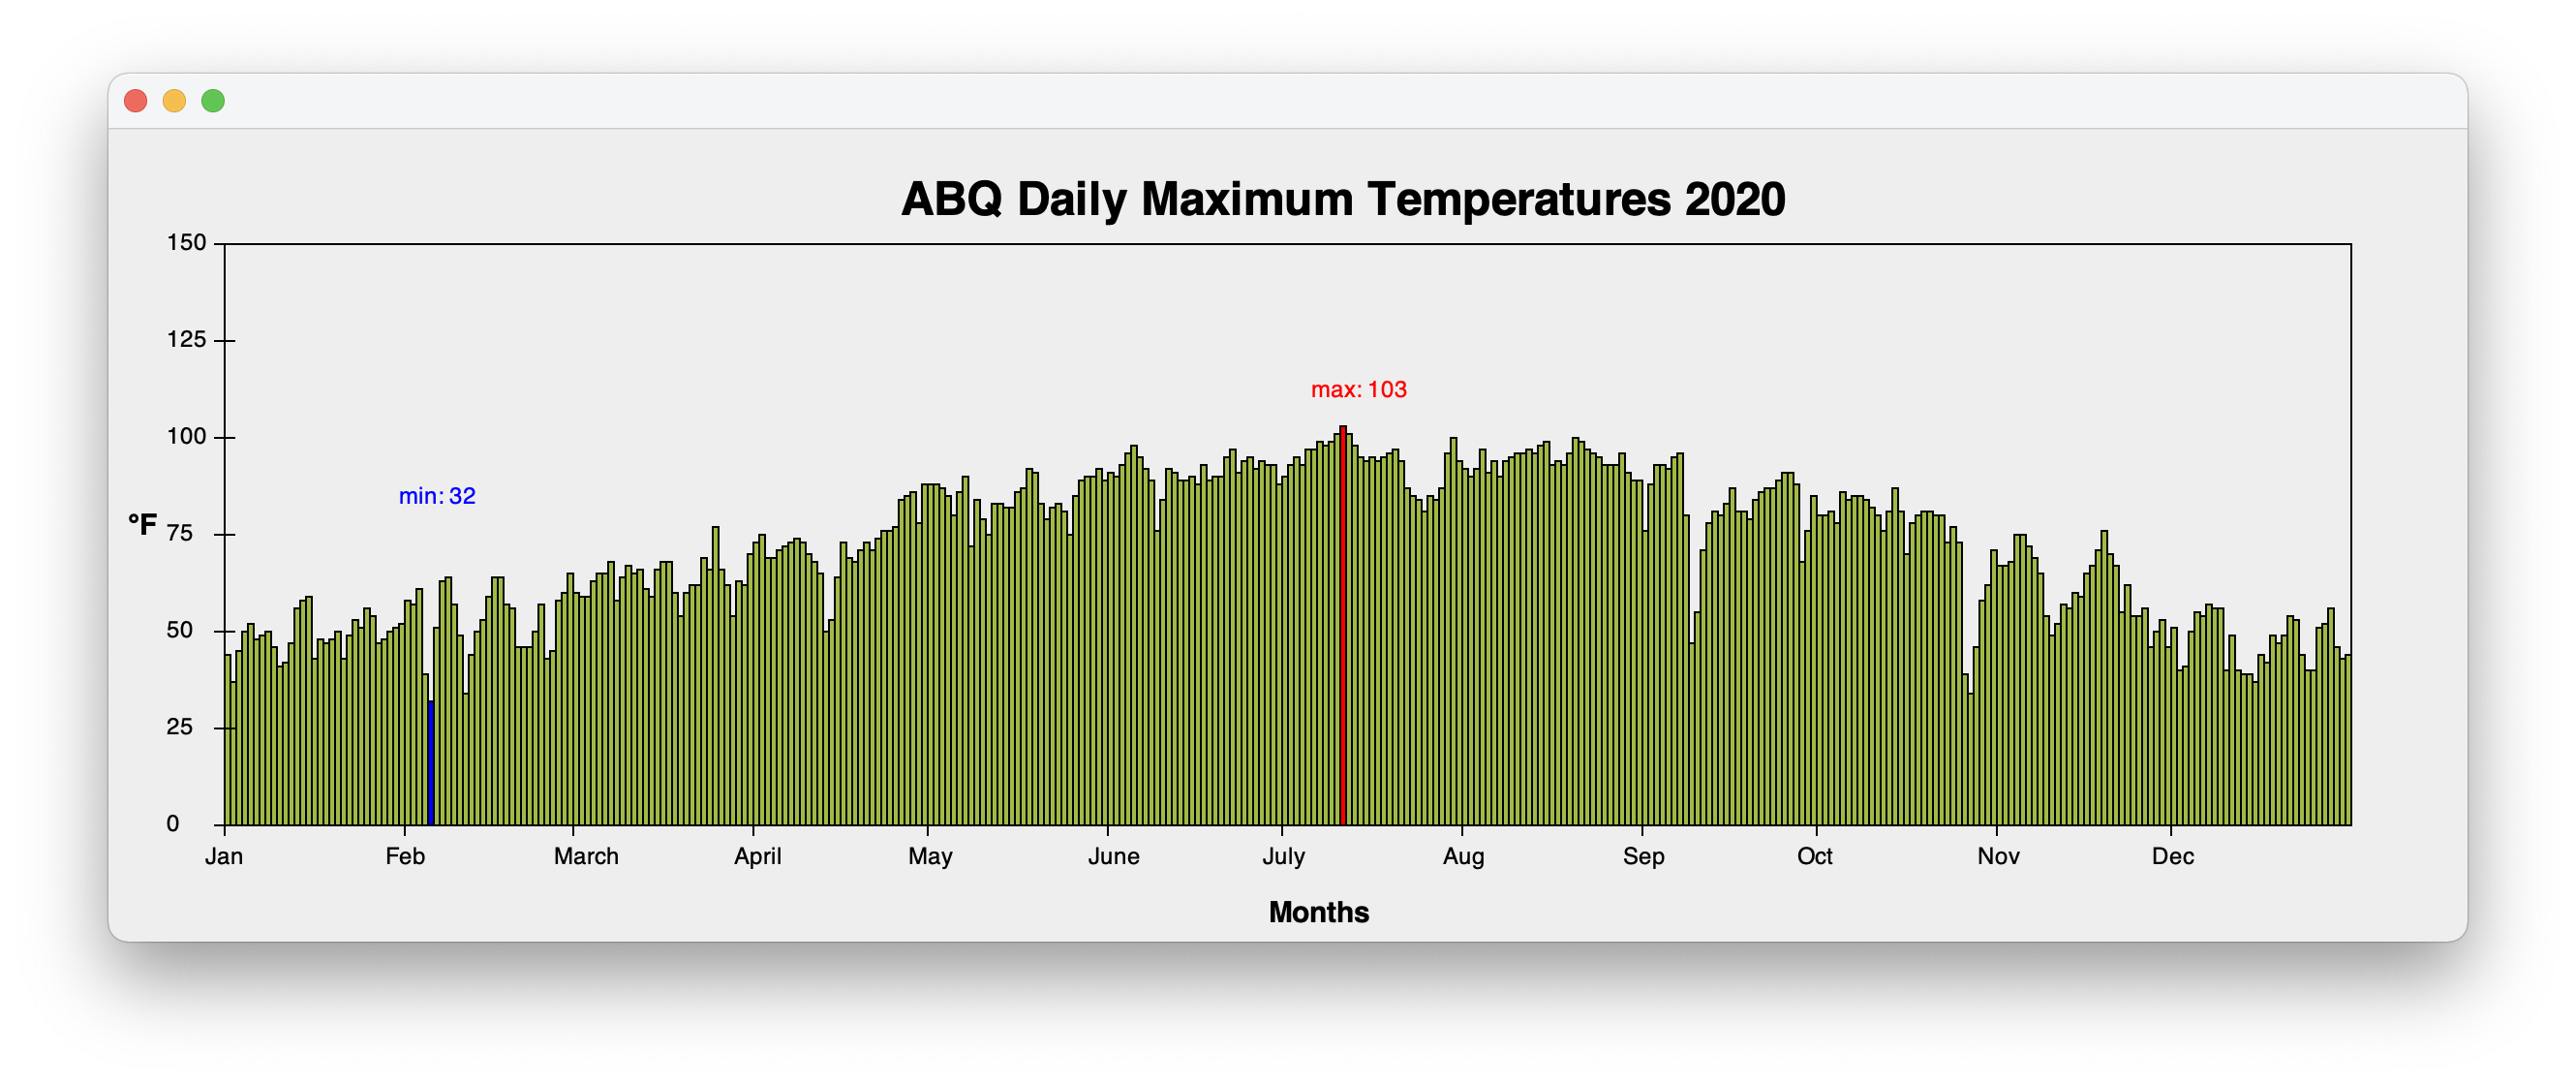
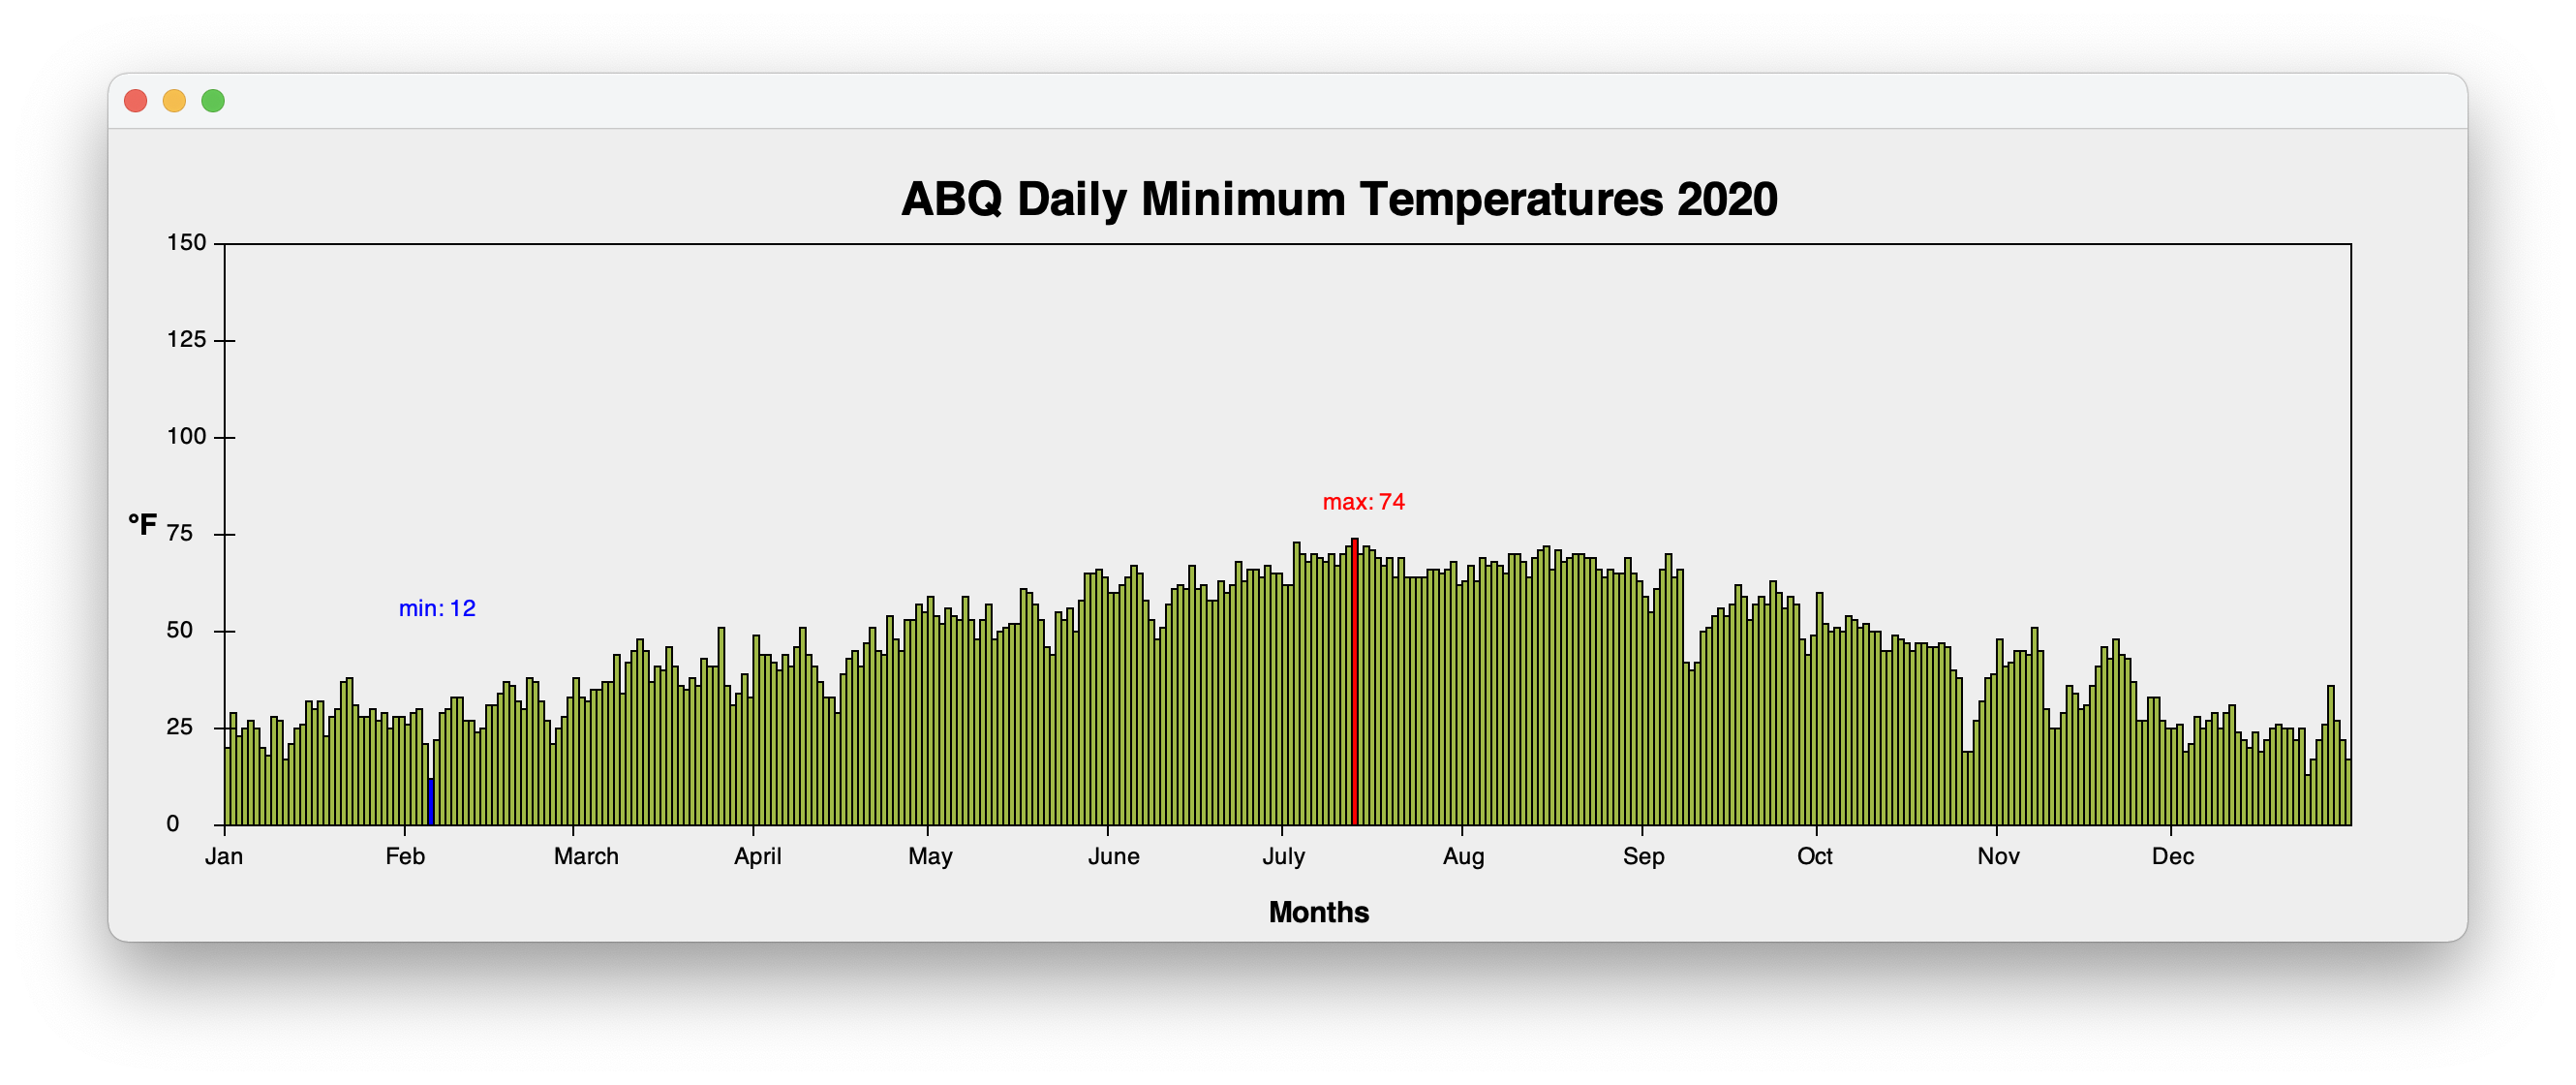
Your program should be able to generate three different bar charts, one for each of the temperature recordings in the dataset: daily average, daily max, and daily min. The y-axis for the graphs should correspond to temperature in degrees Farenheit and should be appropriately labeled (see below). The x-axis for each graph should correspond to days. The x-axis should have labeled tic marks for each month of the year. These tic marks should mark the beginning of each month, as can be seen in the images below. You may find it useful to create an array of ints for the number of days in each month and an array of Strings for the labels for each month to complete this part of the assignment. Note that 2020 was a leap year and February had 29 days. Your finished plots should look like the images below:


To complete this assignment, you will need a parseData method that reads in the relevant three columns of temperature data. Your plots should be generated by a method called barGraph that has two input parameters: a graphics object and an int variable that will select the column of data that should be plotted. You will also need methods to calculate the max and min values. Both of these methods should have an int input parameter that selects the column of data that should be used for the calculation.
Requirements
Your project should include all of the elements below.
- A parseData method that reads in the three columns of temperature data
- A barGraph method that takes a column as input and plots the relevant column of temperature data, with signature: void barGraph(Graphics g, int column)
- A method that calculates the maximum value of a given column, with signature: int max(int column)
- A method that calculates the minimum value of a given column, with signature: int min(int column)
- Your window should be at least 800 pixels wide by 400 pixels high. The actual size will likely be determined by the data and the spacing you choose, but it shouldn't be too small.
- All graphs should include y-axis labels marking every 25 degrees F. The y-axis range should be 0 - 150.
- All graphs should include a y-axis label showing the unit (F).
- All graphs should include x-axis labels marking the months. These tic marks should accurately reflect the days in each month. These tic marks should be located at the beginning of the each month (see images).
- The minimum temperature for each graph should be plotted in blue (see images).
- The minimum temperature value should be written above the appropriate day in blue.
- The maximum temperature for each graph should be plotted in red (see images).
- The maximum temperature value should be written above the appropriate day in red.
- Each graph should include an appropriate (different) title (see images).
- I should be able to change the graph your program generates by changing only the column input parameter passed to the barGraph method. The three plots above were generated by calling barGraph(g,0), barGraph(g,1), and barGraph(g,2).
- Include the appropriate source code header.
- Carefully read and follow the course Style Guidelines.
What to Hand in:
- Your program. Browse to the src folder inside the project that contains your code. Compress the src folder into a .zip file. Rename this file using the following convention: FirstnameLastnameAssignment7.zip. Upload the zip file to Learn. Make sure the file uploaded properly before you submit your assignment.
- Three images. Include an image of each of your three graphs.
- A paragraph about your project. What challenges did you encounter? How did you address them? What did you learn?